

Lamar Jackson And The Entanglement Problem
Big Truss Gets No Respect
? His Teammates Answer")
I dropped the chart below a couple weeks ago when writing about the Justin Herbert extension. My point at the time was that Herbert’s production didn’t match his hype - his gaudy raw stats in touchdowns and passing yards belied a mediocre offense and low impact on winning.
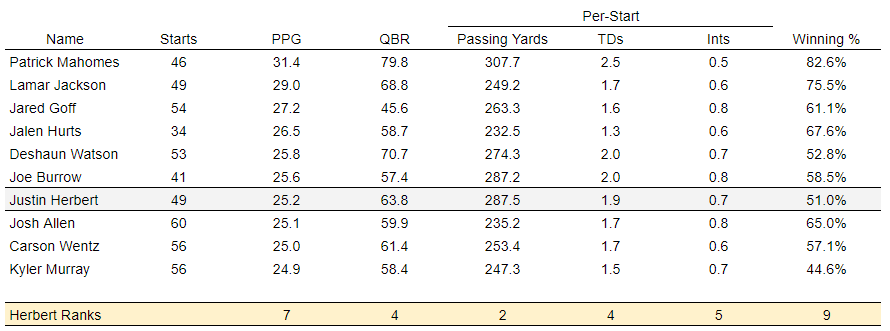
On a second look though, what jumped out was Lamar Jackson. He is second or third in nearly every key statistic, especially the things we care about most for quarterbacks: do they score, and do they win? Yet, Lamar doesn’t get that same level of respect as lower-ranked peers. Most surveys of league coaches and executives have the ex-MVP as the 7th-10th best QB in the league. His critics argue his run-heavy playing style isn’t sustainable, pointing to his bad flameouts in the playoffs as evidence. Teams tend to agree with the doomsday-ists: when Lamar asked to be traded in March as part of acrimonious contract negotiations, seven different teams (!!) came out to say they didn’t want him, including teams with sad-sack QBs like Tampa, Washington, and San Francisco.
I always found this puzzling. Sure, Lamar would have cost a couple first-round picks to acquire (and, yes, veteran QB contracts can be quite a trap), but his profile screamed superstar. I subscribe to the controversial take that any QB who constantly makes the playoffs has the juice to win the Super Bowl, so Lamar’s exemplary regular season record seemed proof in and of itself of his stardom.
But I wanted to take a closer look. Lamar’s injuries the last couple years have dampened his perceived market value, but they give us a remarkable opportunity to use my favorite analytical framework, WOWY (with-or-without-you) analysis, to see how big his contributions really are. The core idea behind WOWY is to look at how teams do with and without a given player on the field. This is incredibly important because most sports suffer from the entanglement problem: it is very hard to separate out individual contributions. This is especially true in football, where a quarterback’s performance alone is a function of his ability to throw a ball but also:
His receiver’s ability to catch it
His offensive line’s ability to block for him
His coach’s ability to put a good scheme around him
His running back’s ability to keep the defense honest
Most advanced statistical models do a lot of crazy math to try and isolate player contributions but it doesn’t fundamentally reduce the challenges of the approach1. WOWY does. It’s the equivalent of a natural experiment, where only one variable (the quarterback) is changing from control to test group. The challenge is the best QBs play every snap, so it’s hard to come up with a “without you” part of the analysis. Things like opponent quality and fumble luck will converge over large sample sizes, but not over two- or three-game samples.
Lamar, luckily, qualifies. Since 2020, he’s played about 3/4 of his team’s games, leaving the Ravens a healthy 13 starts by his backups. Let’s take a look at how his teams did in those games, comparing his impact to other quality QBs in the time frame who missed similar time (Dak Prescott, Tua Tagovailoa, and Jimmy Garropolo).

With Lamar, the Ravens were very good - winning nearly 70% of their games and outscoring opponents by about a touchdown a game - but without him, they would be one of the worst teams in the league. Winning % by itself isn’t a perfect stat, though. Garropolo’s teams score nearly identically with him in and out of the lineup, but win way more with him since his defense is 4 points better in his starts. Similarly, Dak makes his team massively better when he plays but (despite being outscored) his team managed to win over half its games when he was out, so his impact looks negligible.
We can fix this by normalizing winning % for what the QB is responsible for: scoring points. In the below chart, I plotted how likely a team was to win if they scored a given number of points based on the last 5 years of NFL data.

Each point shows a team’s chances of winning (y-axis) based on how many points they scored (x-axis). Teams win less than 10% of the time when they score less than two touchdowns, and almost all the time when they score 40 points or more. Crucially, however, this relationship is not linear. If your quarterback’s contribution is to increase your team’s average scoring output from 0 to 8 points a game, they’ll make 0 impact on winning - ditto if they increase it from 40 to 48 points. In a one-game sample, we’d refer to both of these impacts as “garbage time touchdowns” - since the average team scores 23.5 points a game, going from 0 to 8 or 40 to 48 is pretty unlikely to change the outcome.

This is why you can’t think of Dak’s contributions as the same as Lamar’s. In the graph above, I’ve added a column to the right showing the impact on “expected winning percentage” (calculated by matching points-per-game to the graph above) of a QB’s contributions. It shows what’s already clear: Dak took an already pretty good offense and made it greater; Lamar took a dumpster fire and made it awesome.
The far-most right column shows that Lamar’s teams have actually significantly outperformed the offense when he’s been out of the lineup. This is probably because his defense is a lot better than league average, but could also be because of luck or favorable opponent selection; when he’s in the lineup, there’s nothing fluky about it. The same cannot be said for Jimmy and Tua - both of whom have run way ahead of what their offenses are actually contributing.
Overall, WOWY shows Lamar’s impact to be indisputable. While his passing stats trail many of his contemporaries, based on this we can see he more than makes up for it with what he adds in the run game. This shows up in ways most stats don’t capture; a deeper dive into the box score data showed that with him in the lineup, the running backs on his team go from averaging 4.4 yards per carry when he’s out to 4.9 when he’s beside them - the difference between a functional run offense and a truly threatening one.
Taking the two together, it’s clear these other teams made a big mistake in passing up Lamar. He’s single-handedly elevated a team with a nearly league-worst supporting cast to win 75% of its games since he started. That’s no mirage of the defense either: using my new model, we can see that any team that’s scored 29 points per game (as the Ravens have since Lamar arrived) would expect to win 70% of its games.
This year, for the first time, the Ravens have put serious resources in upgrading the team around Lamar. He’s got two recent first-round wide receivers on the outside, a first-round pick at running back, a top tight end, and a top-end offensive coordinator. If this hypothesis is right, he’s poised for a hellacious year and those teams that passed on him are poised to deeply regret it.
For example, ESPN’s QBR metric separates out how much of a quarterback’s passing yards come before the catch (i.e. from the throw to the receiver) versus after. The latter is seen as more of the receiver’s responsibility, and so assigned a lower rating. But even this is a bit dubious. Yards after catch can come from a receiver breaking tackles, but they can also come because the quarterback put the ball in the right place. The difference of two feet in ball placement could be the difference in the receiver slowing down to catch it and being immediately tackled or racing 15 yards the other direction in stride.
Always look forward to your articles! How do you rate the “skill” of staying healthy though? Is it reasonable to underrate QBs like Lamar whose style leaves him more prone to injuries or Tua who has a history of head injuries?
Side note I’d love to see an analysis on WR contribution in the future. It’s the part of the game you never really see as a fan from the tv view.